10 min read

Jacob Loveless has been a member of Founders Network since June 2018. He’s also been a prominent FN member in our Los Angeles Chapter. To receive peer mentorship from Jacob and over 600 fellow Tech Founders, please request an invite and join our global network.
Building a financial model is one of the first steps you take once you have decided what your company is going to do as a business. Quite simply – how will you survive if you don’t know what your costs and revenues will be? If it seems absurd that you should be able to “guess” with any level of accuracy what a customer would/should/could pay for a product that hasn’t even been born yet: take some comfort in what world-famous statistician George Box said in his 1976 paper in the Journal of the American Statistical Association:
“All models are wrong, but some are useful” George Box
And this is exactly the point. The value of early financial models is the process of building them, not the numbers themselves. It’s this act of coming face to face with questions you have not / don’t want to face on the financial viability of your company that matters. Financial models are the cold bucket of water you need – and I can assure you that you will come out more energized and stronger for having done it.
Prior to a life in startup land, I was a Partner at Cantor Fitzgerald, a leading Wall Street firm where I lived in models every day for 15 years. I have done things in excel that shouldn’t be done. A 6GB spreadsheet? I’ve been there. Multiple spreadsheets that spread calculations across machines? Check. An options model that required a full blow backend database in order to chew through the calculations? Been there and crashed said database.
But the beauty of startup modeling is this: the simpler they are the better they are.
A Model for Models
In my experience, you will generate 3 classes of models over time, each one in increasing complexity.
- Model 0: The Market Model
- Model 1: The Investor Model
- Model 2: The Operating Model
The Market Model is your initial view into what the current market is for your product/service. This is a ‘top down’ model and will introduce you to your competitors. You will come to grips with roughly how much money flows into you market, and who it flows to.
The Investor Model is next. Here we are going to come to grips with our costs and the potential ‘capture’ of our customer spend. The key goals here are:
- Convince yourself that there is a real ability to move customer dollars from their wallet into your wallet.
- Show that you can do so at a pace and cost that is reasonable and;
- Illustrate that the investment required provides you the required ‘runway’ to match the flow of money coming into your company and the flow coming out of your company.
The final model is the Operating model. This will start with you as the founder but will eventually be taken over by your CFO. The operating model is your reality guide. This is the actual forecasts that will increasingly benefit from hindsight. You will grow to both love and hate this model with increasing passion over time but recognize that this model is reality.
Model 0: The Market Model
How big is the market your product exists in? Is this market growing or shrinking? Who are the players in this market today?
A common mistake here is to assume that you are creating a new market! No. There is no such thing as a new market. There are fundamental physics of economics and this is lesson 1. For a customer to spend money with you, you are convincing them to move that spend from something else. That something else is your market.
Another common mistake? Assuming you will take X% of a massive market. A healthy dose of reality here is helpful. Let’s work with an example. Let’s say StartupCo has invented a new truly ground-breaking database that is 100x faster than anything the world has ever seen. Dope. What’s the market look like? A quick visit over to Statista will help us out:
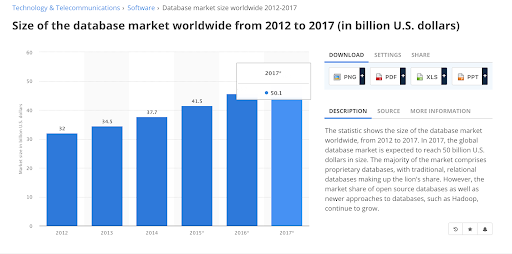
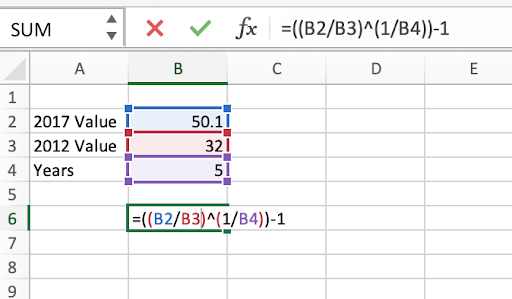
So, the worldwide market for databases is ~50B. That’s a big market, and best of all its growing. It’s worth meeting our first acronym here: CAGR or Compound Annual Growth Rate. This says what % the market increases in size (on average) year over year. To get the CAGR of a market we take the ending value, divide it by the begging value (to get the total % change over time) then adjust for the number of years and subtract 1.

Calculate CAGR
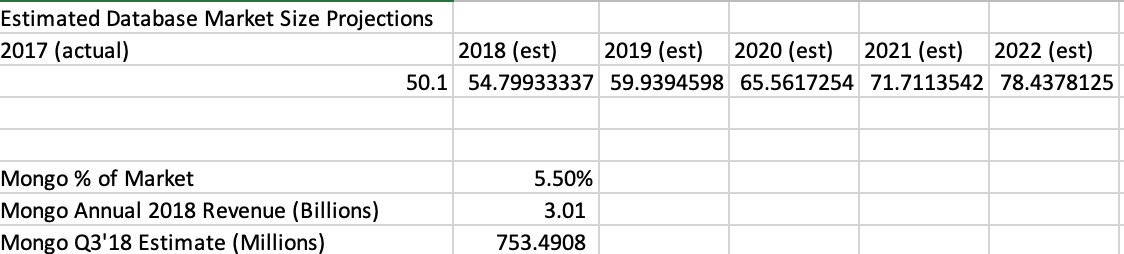
So now we have a rough feeling of the opportunity size today and roughly what that might look like 5 years out. To forward project the market size we can simply add in our CAGR and (while waving jazz hands) we now have something we can work with. So, our 50B market will grow to nearly 80B by 2022.
Who plays in this market today? A quick Google search for “database market share” brings us to here: https://db-engines.com/en/ranking .
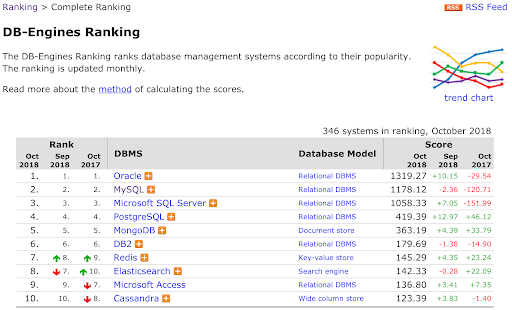
This data also seems reasonable given that Oracle (a massive company) is #1 (and #2) followed by Microsoft. A quick copy-paste into excel and we can use these scores to guesstimate market share:
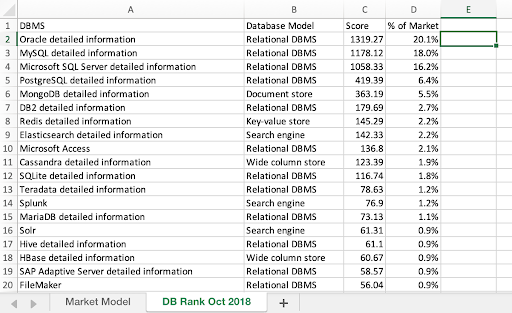
Our next task here is to figure out how long it’s taken a player to get to this position. This is very hard with conglomerates like Oracle where database revenue is rarely (if ever) broken out over time. So, a common trick is to find a pure play company (that is also public).
Lucky for us such a player not only exists, but it substantial in size: MongoDB (NASDAQ: MDB). Mongo went public in October of 2017 so we can access their financials to get their earnings. Our base guess says MongoDB (at 5.5% of the market) would have Q3’18 revenue of roughly 750 million. How? Well our base market share above say’s Mongo owns ~5.5% of the market, a market that should have 2018 revenues of 54 billion, and we’re looking at a single quarter (1/4 of a full year). So 54 billion * 5.5% % 4 ~= 750 million dollars.
Now let’s have a look at the actual revenue from Mongo (using Yahoo finance)
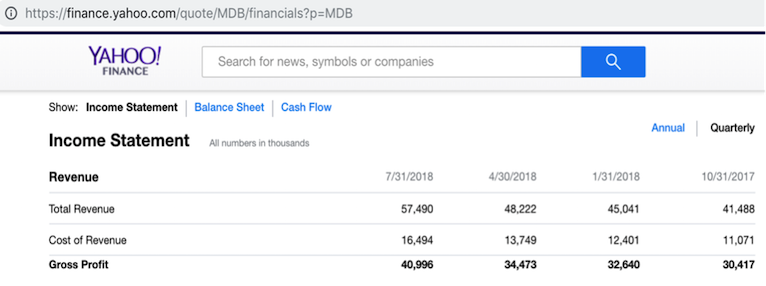
So, in the 3rd Quarter Mongo booked 57 million in revenue, not 750 million. Wait what? This first hit of cold water is an introduction to new product pricing and revenue capture. The market might be 54 billion, but the new players need to price to win accounts. A further realization is that our database market share is likely the percentage of customers in deployment not percentage of actual dollars.
Using this new information we can conservatively estimate that our capture of actual dollars as a relationship to capture of market share will be off by a factor of 10-20x. Ouch. But no worries, it’s still a giant market.
Let’s now have a look at what is a realistic percentage of market share we can expect to get. Looking again to MongoDB (our pure play comparison) we see it was founded in 2007. We could try to find some historical market share data (and you should try) but it’s unlikely we can get something clean. As an alternative we can apply a general model and see where things end up. We can assume that our starting market share is 0%, and we’ll just plug in Mongo’s ending state at 5.5% ~11 years later.
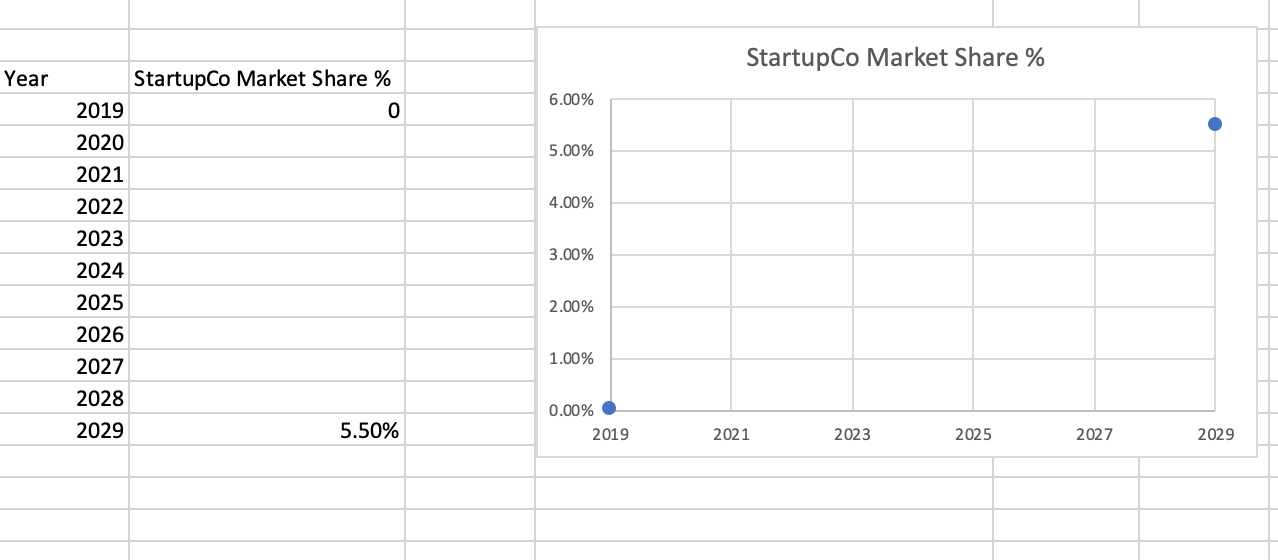
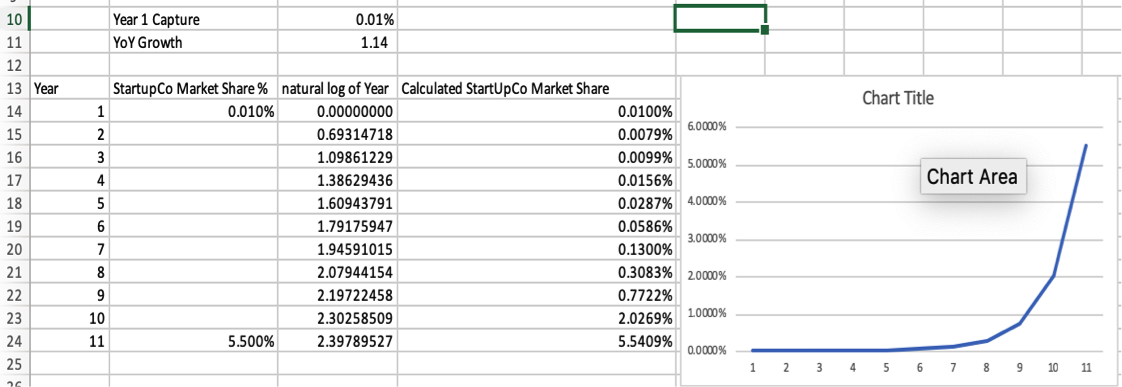
Now it’s tempting to just connect the dots, but rarely does adoption work this way. If we are able to “wow” the market, we could assume the exponential growth in the early years! But models are for reality, and the reality is traction is hard. Product market fit is hard. Scaling sales is hard. So, let’s use the use the opposite function – the natural log.
A good way to model logarithmic growth is to simply multiply the year in business * ln (excels natural log function).
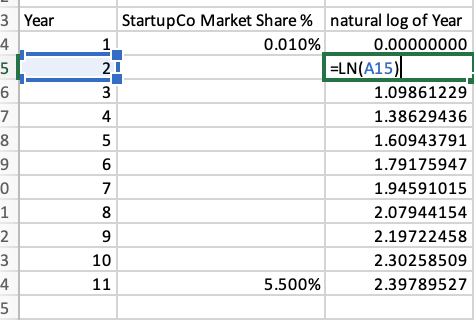
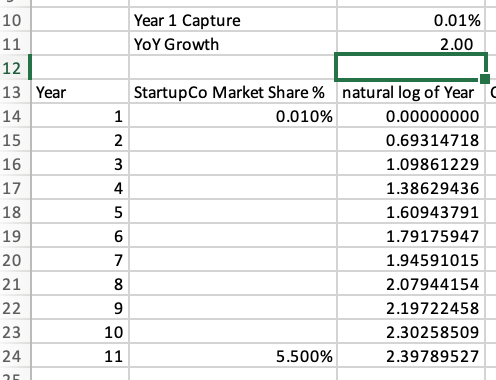
This will give us a logarithmic curve to base our model in. We then need 2 variables (only 1 of which really matters) which is what % of the market can we realistically capture in year 1? The second variable is our year over year growth multiplier. For now, just plug in 2 (200%) for growth.
Let’s assume we capture 0.01% of the market in year 1 – or about 1 out of every 550 MongoDB customers. That seems reasonable although reasonable people may disagree.
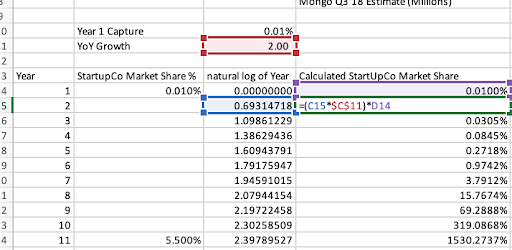
We then apply our growth function by using our logarithmic base * our growth rate * the previous year’s market share. What we end up with is nonsense (1500% of the market) but we’re going to fix that in just a second.
We can now solve for the growth rate that has us arrive at MongoDB’s market share in year 11. To do this we use Excel’s Goal Seek function.
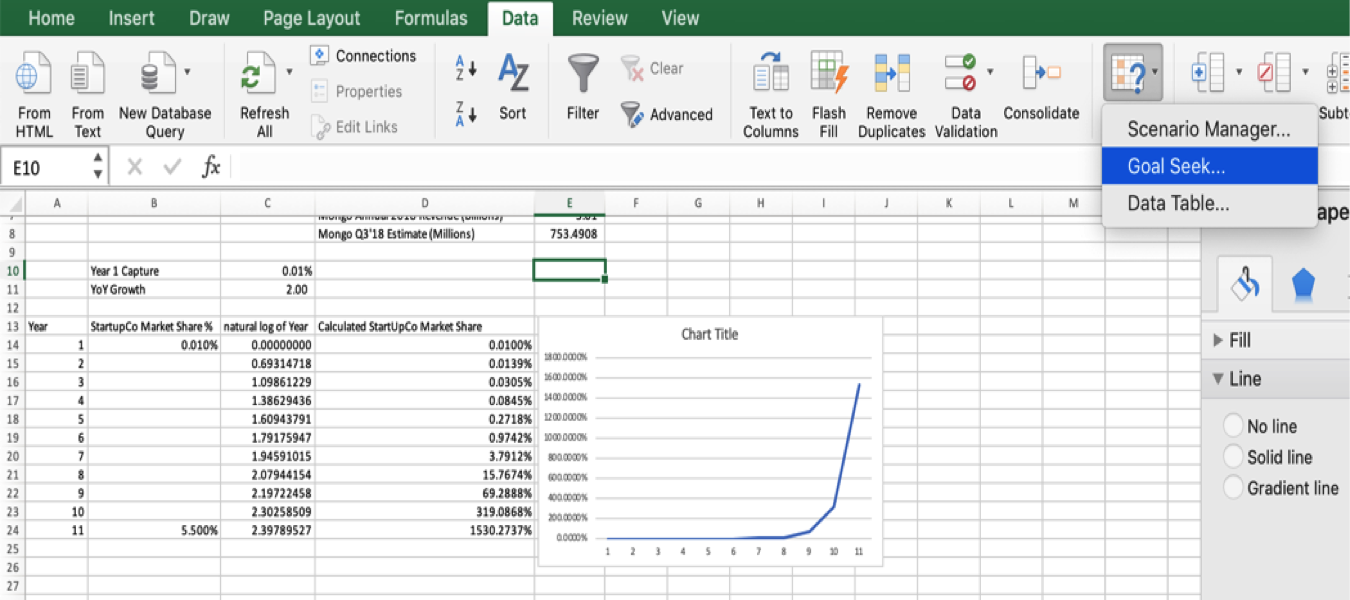
We plug in our variables. In my working spreadsheet I want to set the value of the last year’s market share to 5.5% (Mongo’s market share) by adjusting my YoY growth rate.

When you hit “OK” excel will run a number of calculations to find an optimal solution. In this case it gives a year over year rate of 1.14 (114%) and our chart now looks like what we may not want to see but need to see: a slow and steady struggle to find adoption followed by rapid growth.
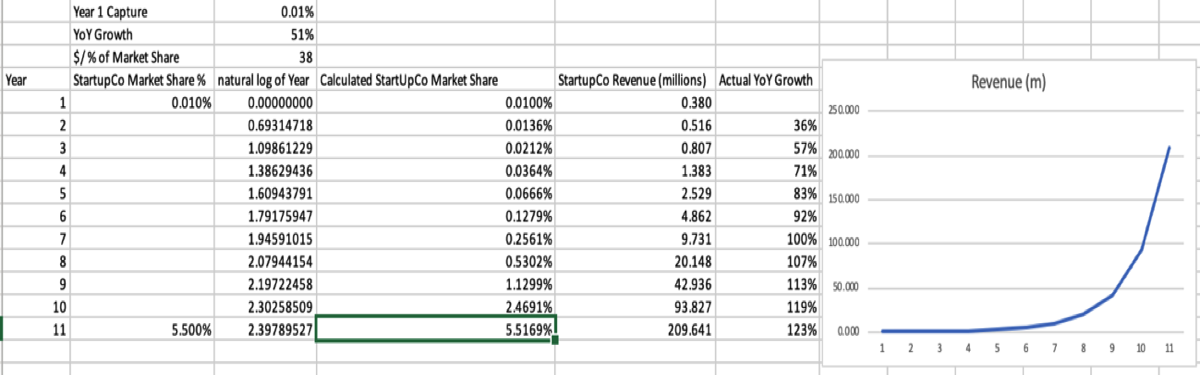
Our last needed estimate is what we expect 1% of market share is worth in terms of dollars. Our MongoDB example earlier shows us it’s not quite what we expected, but again – it’s a giant market. Let’s assume MongoDB has revenues of 210 million in 2018. This doesn’t seem unreasonable given they have 154 million in revenues going into Q4. Let’s further assume their market share stays at ~5.5%. So that means that 5.5% of the market is worth 210 million, so 1% of market share is worth ~38 million dollars (1/5.5 = .18 * 210 ~ 38 million). We can plug this in and now get our revenue model. We multiply 38 million * our calculated market share *100 and
What we see is a business doing roughly 210 million per year in revenue in 11 years.
From here we now start to ask ourselves the hard questions. Are we able to charge 2x Mongo? 10x Mongo? If so, then maybe the fair value of 1% of market is 2x or 10x higher. By way of example, my friend Arthur Whitney’s company makes Kdb+ with a market share 83x lower then Mongo – yet KX Systems was a very consistent 10mm per year company for nearly 25 years. Why? Kdb+ is ~100x more expensive than MongoDB but worth every penny – which is why its run by banks, exchanges and major utility companies. Can we grow faster than MongoDB? 2x faster? The key point of the market model is to bring these questions to the forefront.
In our next installment we’ll look at the Investor Model and bring costs into the picture.
Good luck!


Looking for startup advice, connections, and insights?
Tap into a global network that enables you to answer questions, build relationships, and gain the perspective you need to move faster.
Peer mentorship with fellow tech founders
Pitch practice with Tier 1 VCs
Accelerator grade discounts